

Defense, intelligence, and IT solutions provider CACI International (NYSE:CACI) reported Q3 CY2025 results beating Wall Street’s revenue expectations, with sales up 11.2% year on year to $2.29 billion. On the other hand, the company’s full-year revenue guidance of $9.3 billion at the midpoint came in 0.5% below analysts’ estimates. Its non-GAAP profit of $6.85 per share was 10.9% above analysts’ consensus estimates.
Is now the time to buy CACI? Find out by accessing our full research report, it’s free for active Edge members.
CACI (CACI) Q3 CY2025 Highlights:
- Revenue: $2.29 billion vs analyst estimates of $2.26 billion (11.2% year-on-year growth, 1% beat)
- Adjusted EPS: $6.85 vs analyst estimates of $6.18 (10.9% beat)
- Adjusted EBITDA: $268.6 million vs analyst estimates of $245.2 million (11.7% margin, 9.5% beat)
- The company reconfirmed its revenue guidance for the full year of $9.3 billion at the midpoint
- Management reiterated its full-year Adjusted EPS guidance of $27.58 at the midpoint
- Operating Margin: 9.3%, in line with the same quarter last year
- Free Cash Flow Margin: 6.2%, up from 1.1% in the same quarter last year
- Backlog: $33.9 billion at quarter end, up 4.6% year on year
- Market Capitalization: $11.74 billion
“CACI’s exceptional start to fiscal year 2026 underscores our differentiated position in the market. We delivered strong financial results across the board, including robust free cash flow driven by double-digit revenue growth and strong profitability,” said John Mengucci, CACI President and Chief Executive Officer.
Company Overview
Founded to commercialize SIMSCRIPT, CACI International (NYSE:CACI) offers defense, intelligence, and IT solutions to support national security and government transformation efforts.
Revenue Growth
A company’s long-term sales performance is one signal of its overall quality. Any business can put up a good quarter or two, but many enduring ones grow for years. Thankfully, CACI’s 8.8% annualized revenue growth over the last five years was decent. Its growth was slightly above the average industrials company and shows its offerings resonate with customers.
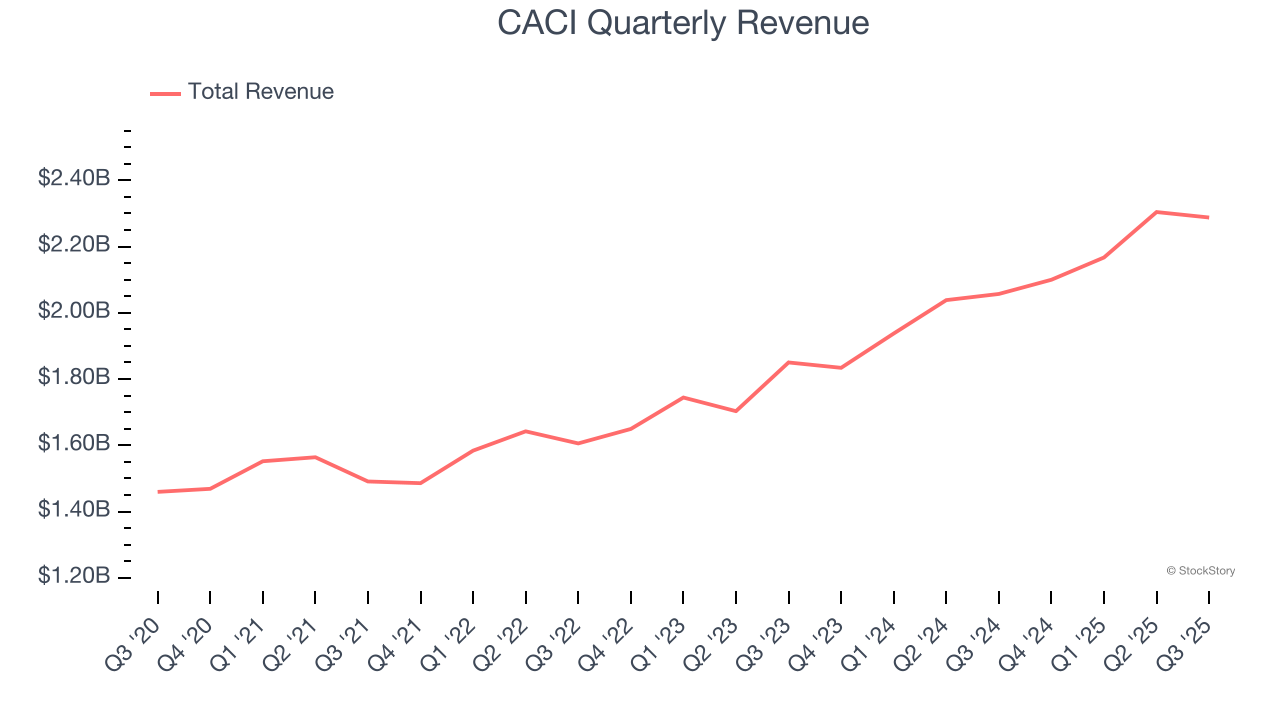
We at StockStory place the most emphasis on long-term growth, but within industrials, a half-decade historical view may miss cycles, industry trends, or a company capitalizing on catalysts such as a new contract win or a successful product line. CACI’s annualized revenue growth of 12.9% over the last two years is above its five-year trend, suggesting its demand recently accelerated. 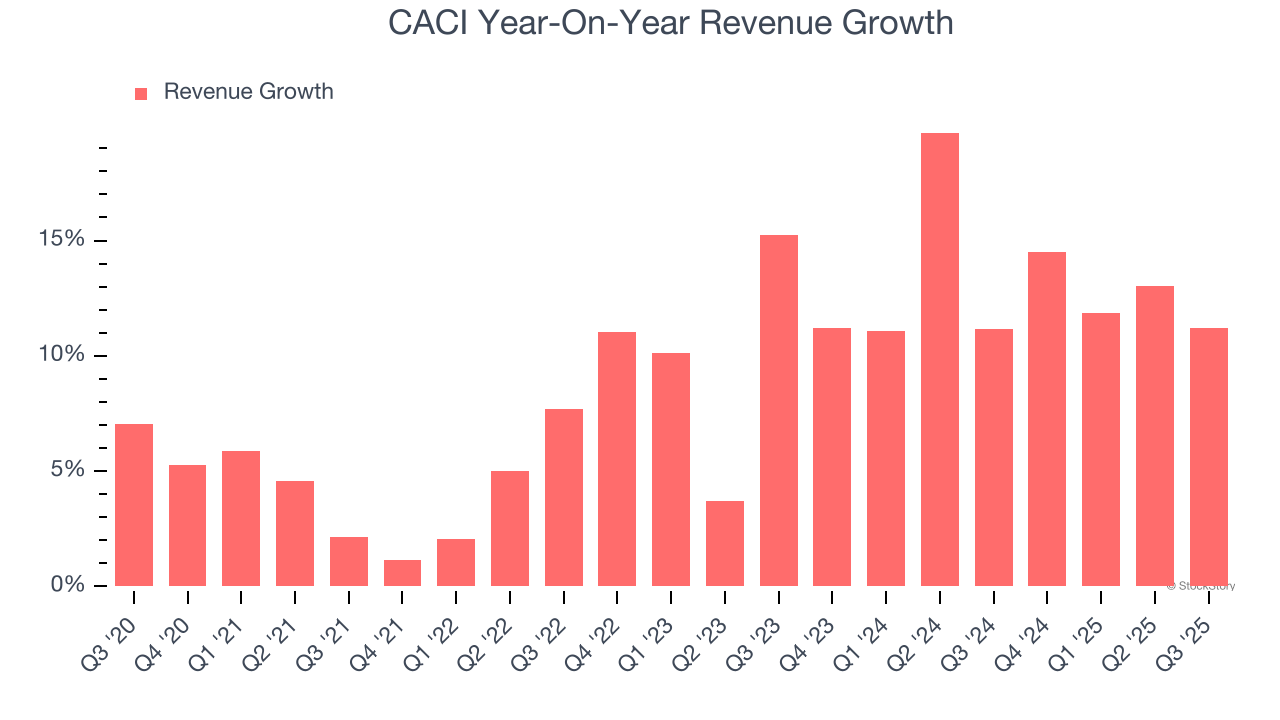
We can better understand the company’s revenue dynamics by analyzing its backlog, or the value of its outstanding orders that have not yet been executed or delivered. CACI’s backlog reached $33.9 billion in the latest quarter and averaged 11.3% year-on-year growth over the last two years. Because this number is lower than its revenue growth, we can see the company fulfilled orders at a faster rate than it added new orders to the backlog. This implies CACI was operating efficiently but raises questions about the health of its sales pipeline. 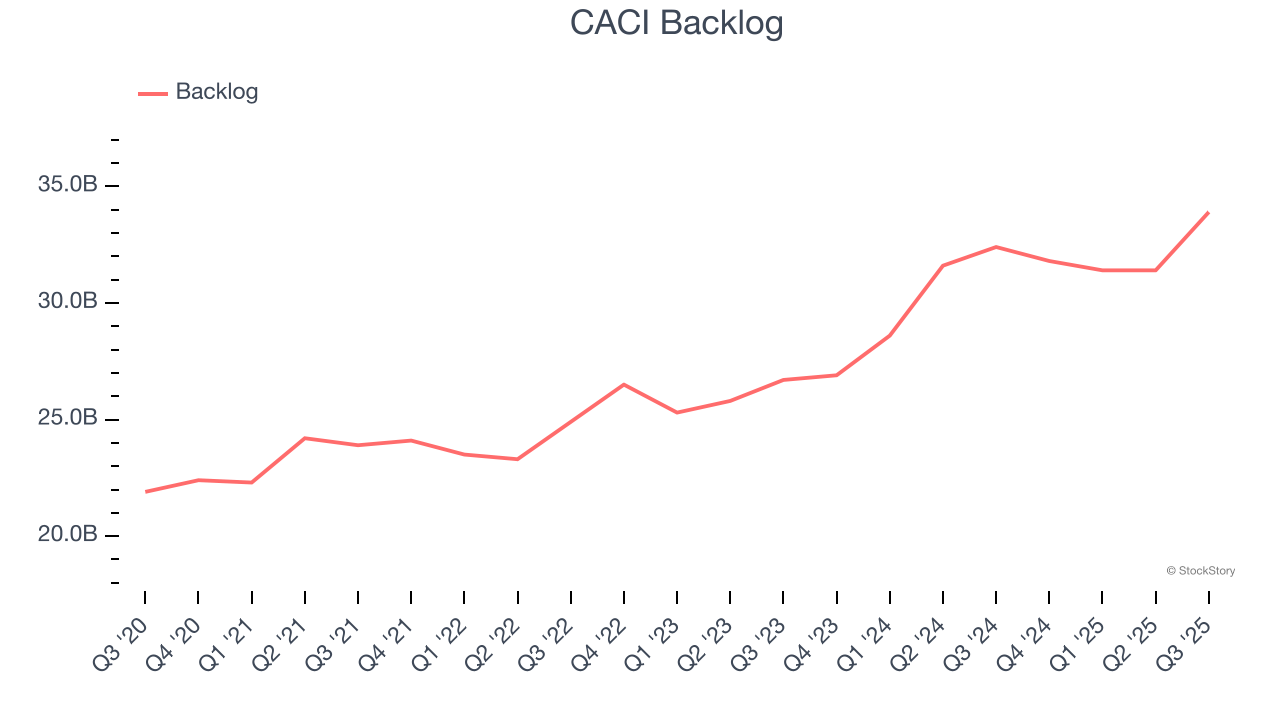
This quarter, CACI reported year-on-year revenue growth of 11.2%, and its $2.29 billion of revenue exceeded Wall Street’s estimates by 1%.
Looking ahead, sell-side analysts expect revenue to grow 6.8% over the next 12 months, a deceleration versus the last two years. This projection is underwhelming and suggests its products and services will face some demand challenges. At least the company is tracking well in other measures of financial health.
Software is eating the world and there is virtually no industry left that has been untouched by it. That drives increasing demand for tools helping software developers do their jobs, whether it be monitoring critical cloud infrastructure, integrating audio and video functionality, or ensuring smooth content streaming. Click here to access a free report on our 3 favorite stocks to play this generational megatrend.
Operating Margin
Operating margin is an important measure of profitability as it shows the portion of revenue left after accounting for all core expenses – everything from the cost of goods sold to advertising and wages. It’s also useful for comparing profitability across companies with different levels of debt and tax rates because it excludes interest and taxes.
CACI’s operating margin might fluctuated slightly over the last 12 months but has generally stayed the same, averaging 8.6% over the last five years. This profitability was higher than the broader industrials sector, showing it did a decent job managing its expenses.
Looking at the trend in its profitability, CACI’s operating margin might fluctuated slightly but has generally stayed the same over the last five years. This raises questions about the company’s expense base because its revenue growth should have given it leverage on its fixed costs, resulting in better economies of scale and profitability.
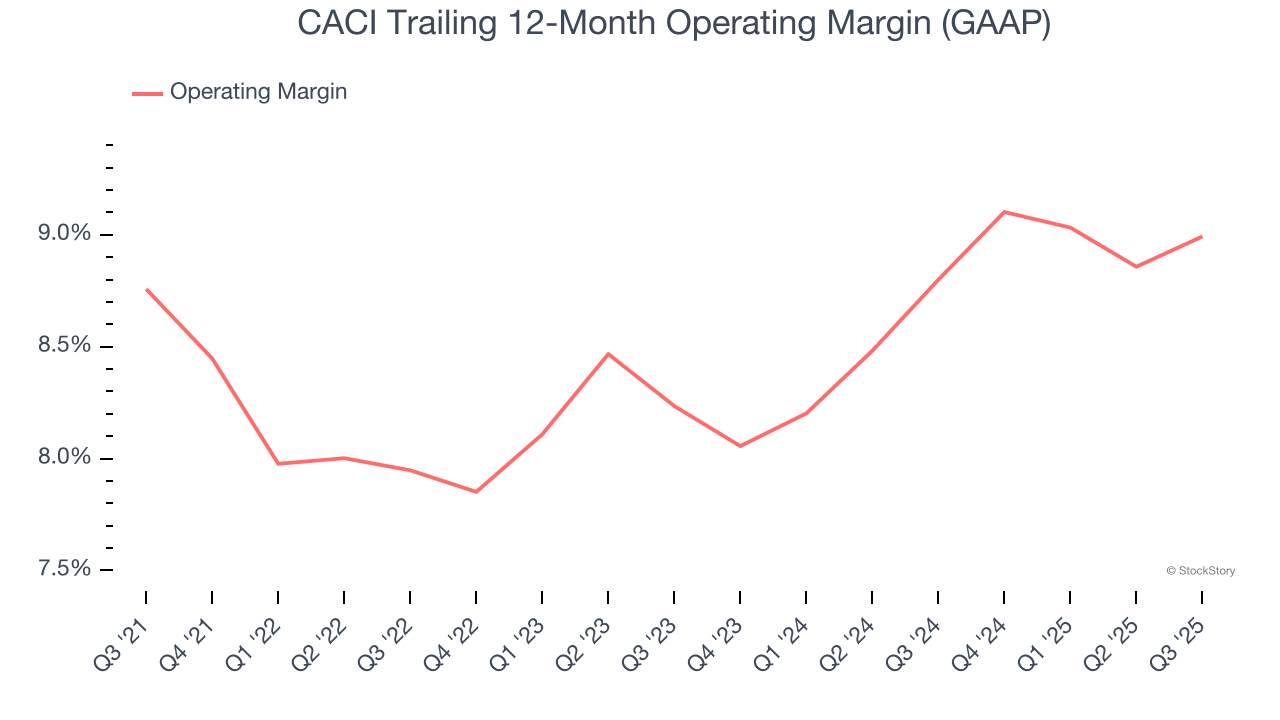
This quarter, CACI generated an operating margin profit margin of 9.3%, in line with the same quarter last year. This indicates the company’s overall cost structure has been relatively stable.
Earnings Per Share
We track the long-term change in earnings per share (EPS) for the same reason as long-term revenue growth. Compared to revenue, however, EPS highlights whether a company’s growth is profitable.
CACI’s EPS grew at a remarkable 12.3% compounded annual growth rate over the last five years, higher than its 8.8% annualized revenue growth. However, this alone doesn’t tell us much about its business quality because its operating margin didn’t improve.
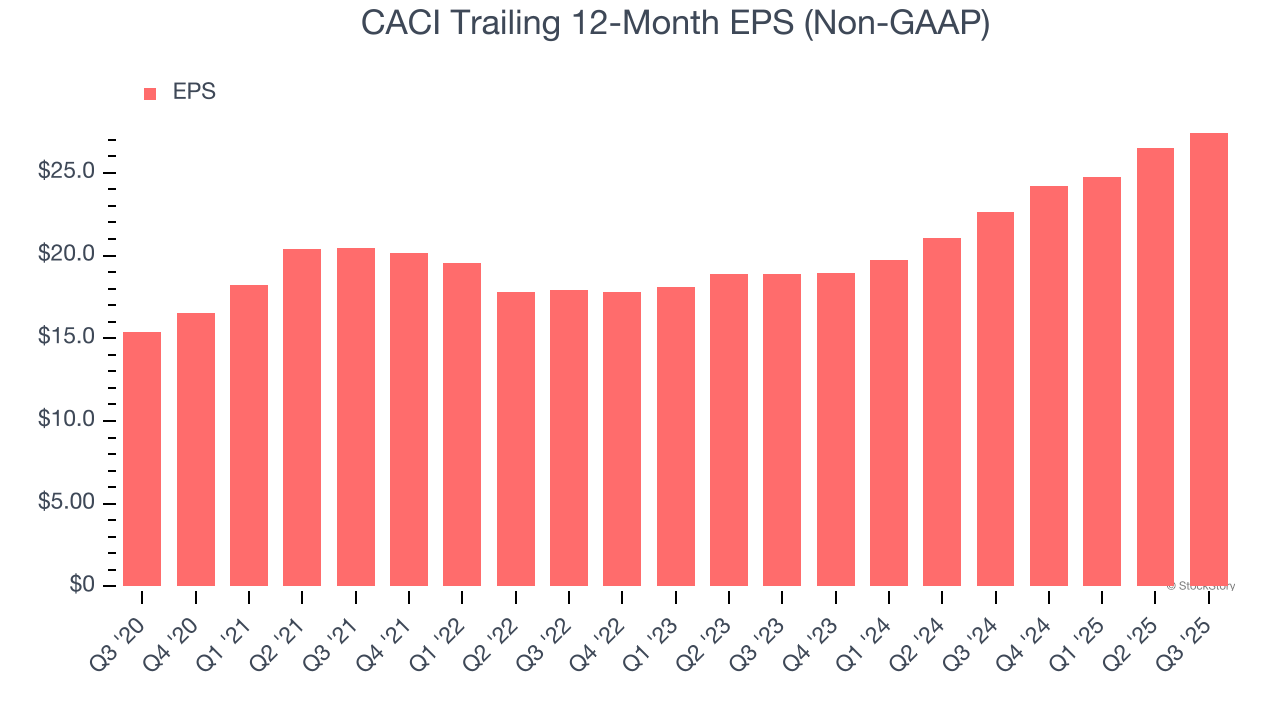
Diving into the nuances of CACI’s earnings can give us a better understanding of its performance. A five-year view shows that CACI has repurchased its stock, shrinking its share count by 13%. This tells us its EPS outperformed its revenue not because of increased operational efficiency but financial engineering, as buybacks boost per share earnings. 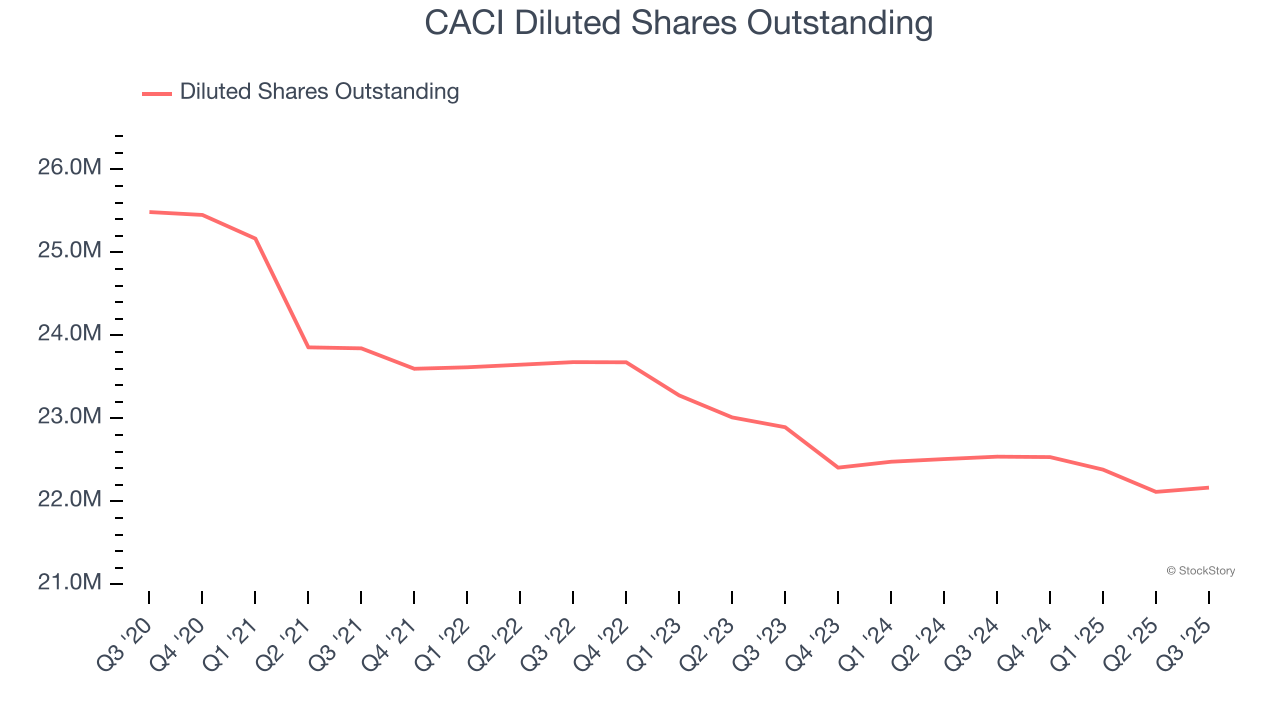
Like with revenue, we analyze EPS over a more recent period because it can provide insight into an emerging theme or development for the business.
For CACI, its two-year annual EPS growth of 20.6% was higher than its five-year trend. We love it when earnings growth accelerates, especially when it accelerates off an already high base.
In Q3, CACI reported adjusted EPS of $6.85, up from $5.93 in the same quarter last year. This print easily cleared analysts’ estimates, and shareholders should be content with the results. Over the next 12 months, Wall Street expects CACI’s full-year EPS of $27.43 to grow 5.2%.
Key Takeaways from CACI’s Q3 Results
We were impressed by how significantly CACI blew past analysts’ EBITDA expectations this quarter. We were also glad its EPS outperformed Wall Street’s estimates. On the other hand, its full-year EPS guidance missed and its full-year revenue guidance fell slightly short of Wall Street’s estimates. Overall, this print was mixed. The stock remained flat at $525 immediately following the results.
Is CACI an attractive investment opportunity at the current price? The latest quarter does matter, but not nearly as much as longer-term fundamentals and valuation, when deciding if the stock is a buy. We cover that in our actionable full research report which you can read here, it’s free for active Edge members.