

Hospitality company Travel + Leisure (NYSE:TNL) announced better-than-expected revenue in Q3 CY2025, with sales up 5.1% year on year to $1.04 billion. Its non-GAAP profit of $1.80 per share was 5.2% above analysts’ consensus estimates.
Is now the time to buy Travel + Leisure? Find out by accessing our full research report, it’s free for active Edge members.
Travel + Leisure (TNL) Q3 CY2025 Highlights:
- Revenue: $1.04 billion vs analyst estimates of $1.03 billion (5.1% year-on-year growth, 1% beat)
- Adjusted EPS: $1.80 vs analyst estimates of $1.71 (5.2% beat)
- Adjusted EBITDA: $266 million vs analyst estimates of $254.8 million (25.5% margin, 4.4% beat)
- EBITDA guidance for the full year is $975 million at the midpoint, in line with analyst expectations
- Operating Margin: 20.5%, up from 19% in the same quarter last year
- Free Cash Flow Margin: 19.3%, up from 12.6% in the same quarter last year
- Tours Conducted: 200,000, up 5,000 year on year
- Market Capitalization: $3.94 billion
Company Overview
Formerly known as Wyndham Destinations, Travel + Leisure (NYSE:TNL) is a global vacation company that provides travelers with vacation ownership, exchange, and travel services.
Revenue Growth
Reviewing a company’s long-term sales performance reveals insights into its quality. Any business can have short-term success, but a top-tier one grows for years. Unfortunately, Travel + Leisure’s 9.7% annualized revenue growth over the last five years was tepid. This was below our standard for the consumer discretionary sector and is a poor baseline for our analysis.
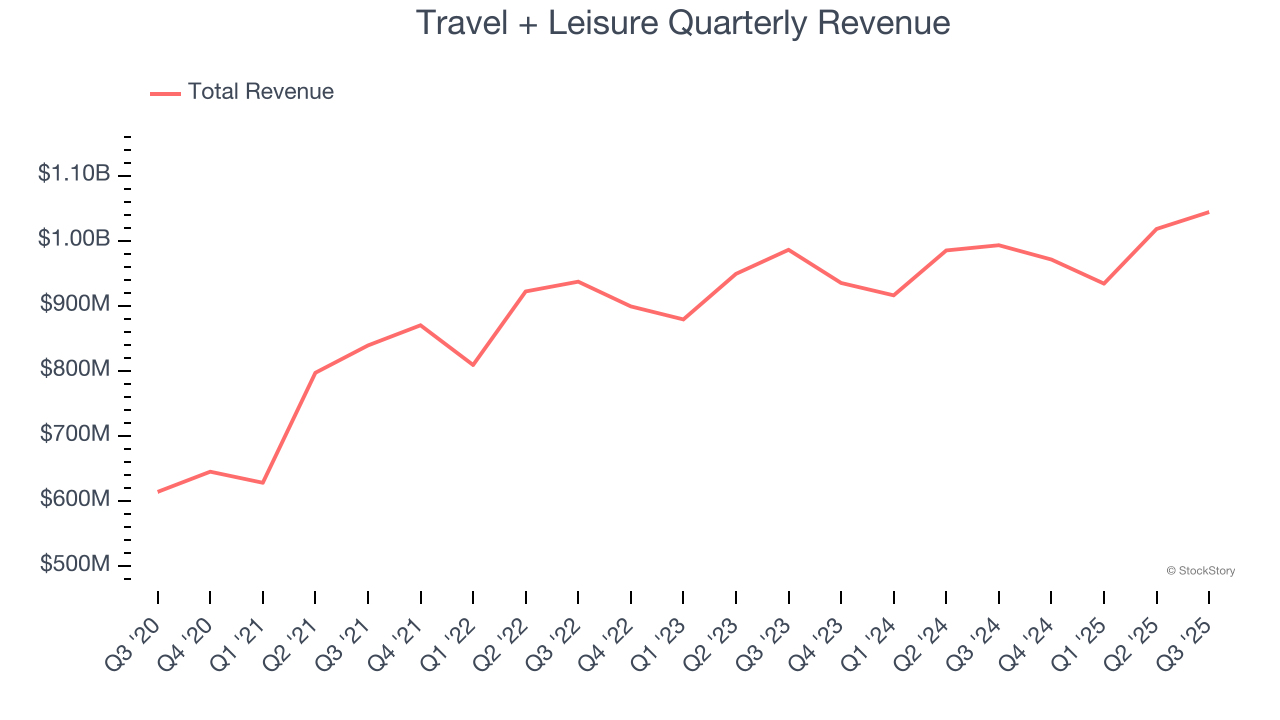
We at StockStory place the most emphasis on long-term growth, but within consumer discretionary, a stretched historical view may miss a company riding a successful new property or trend. Travel + Leisure’s recent performance shows its demand has slowed as its annualized revenue growth of 3.4% over the last two years was below its five-year trend. 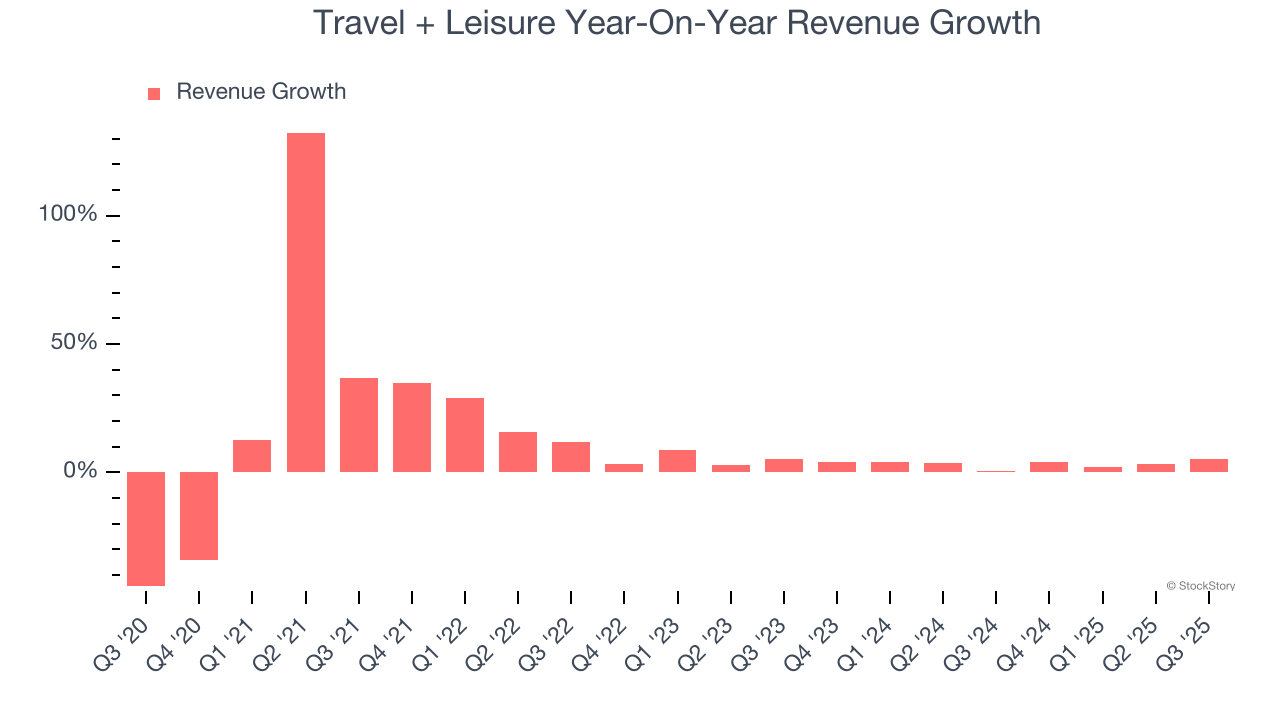
We can better understand the company’s revenue dynamics by analyzing its number of tours conducted, which reached 200,000 in the latest quarter. Over the last two years, Travel + Leisure’s tours conducted averaged 6.8% year-on-year growth. Because this number is higher than its revenue growth during the same period, we can see the company’s monetization has fallen. 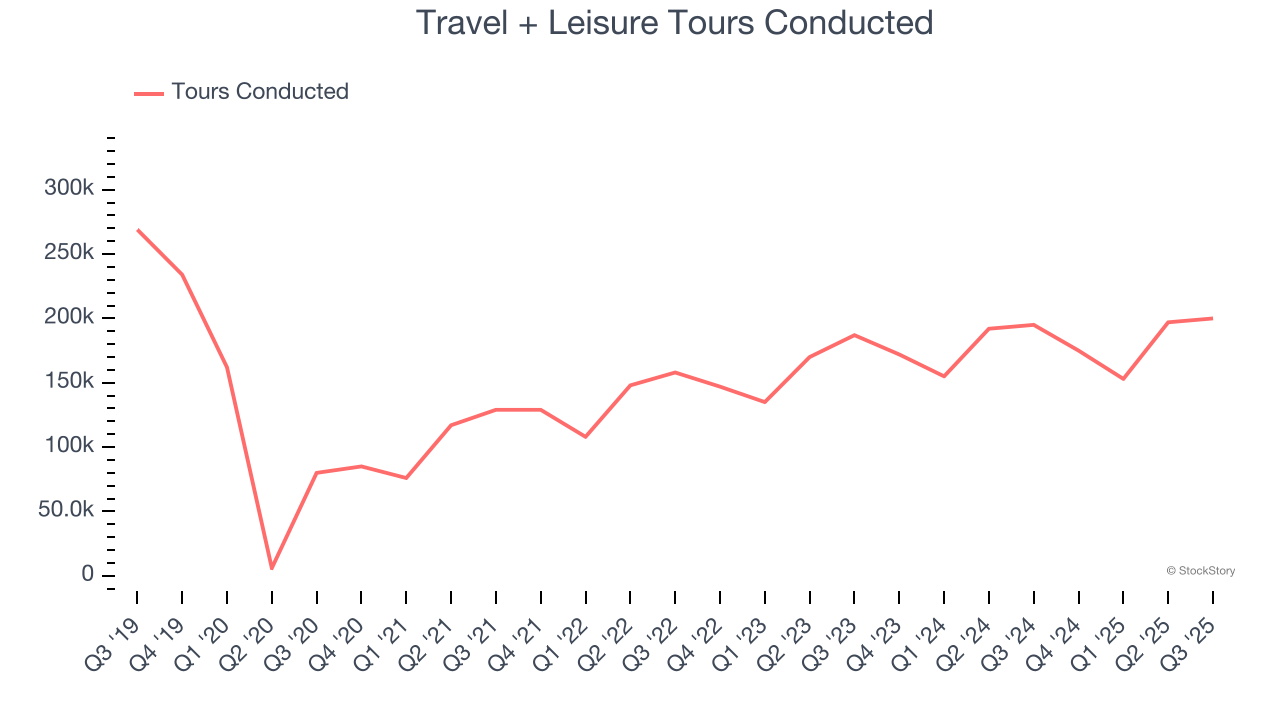
This quarter, Travel + Leisure reported year-on-year revenue growth of 5.1%, and its $1.04 billion of revenue exceeded Wall Street’s estimates by 1%.
Looking ahead, sell-side analysts expect revenue to grow 3.7% over the next 12 months, similar to its two-year rate. This projection doesn't excite us and implies its newer products and services will not lead to better top-line performance yet.
Unless you’ve been living under a rock, it should be obvious by now that generative AI is going to have a huge impact on how large corporations do business. While Nvidia and AMD are trading close to all-time highs, we prefer a lesser-known (but still profitable) stock benefiting from the rise of AI. Click here to access our free report one of our favorites growth stories.
Operating Margin
Operating margin is a key measure of profitability. Think of it as net income - the bottom line - excluding the impact of taxes and interest on debt, which are less connected to business fundamentals.
Travel + Leisure’s operating margin might fluctuated slightly over the last 12 months but has remained more or less the same, averaging 19.3% over the last two years. This profitability was top-notch for a consumer discretionary business, showing it’s an well-run company with an efficient cost structure.
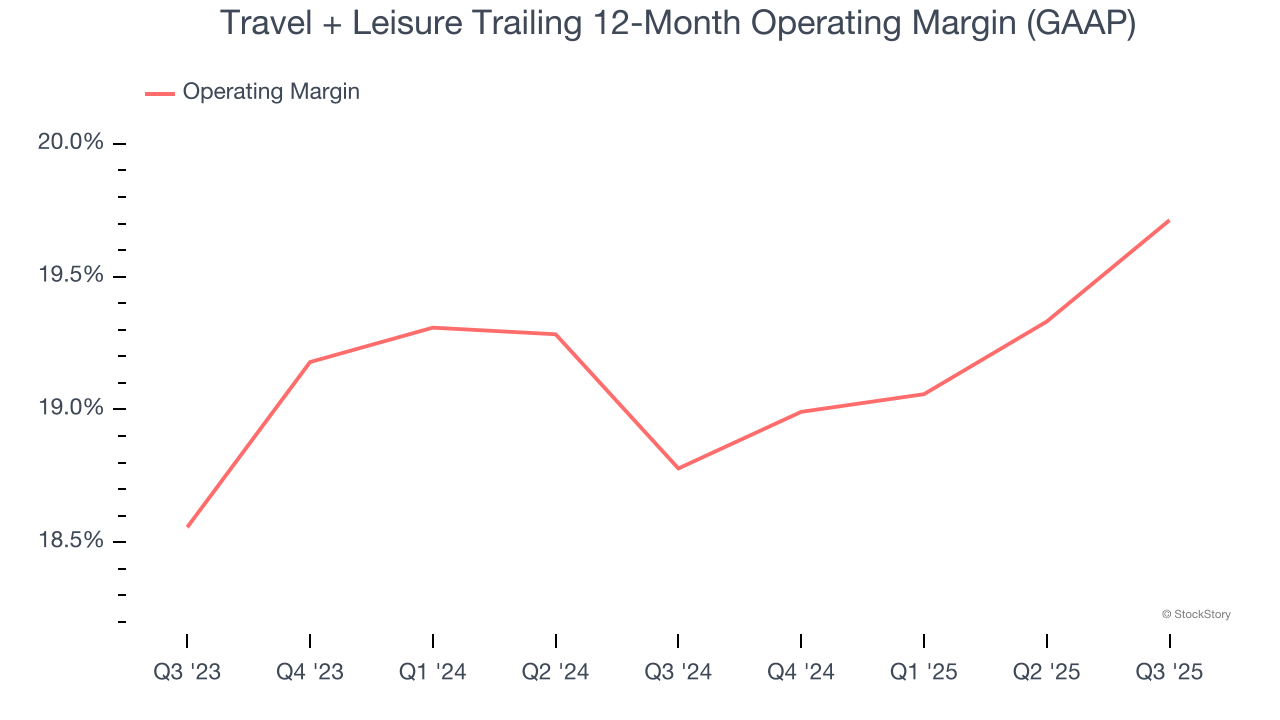
In Q3, Travel + Leisure generated an operating margin profit margin of 20.5%, up 1.5 percentage points year on year. This increase was a welcome development and shows it was more efficient.
Earnings Per Share
We track the long-term change in earnings per share (EPS) for the same reason as long-term revenue growth. Compared to revenue, however, EPS highlights whether a company’s growth is profitable.
Travel + Leisure’s EPS grew at an astounding 81.4% compounded annual growth rate over the last five years, higher than its 9.7% annualized revenue growth. This tells us the company became more profitable on a per-share basis as it expanded.
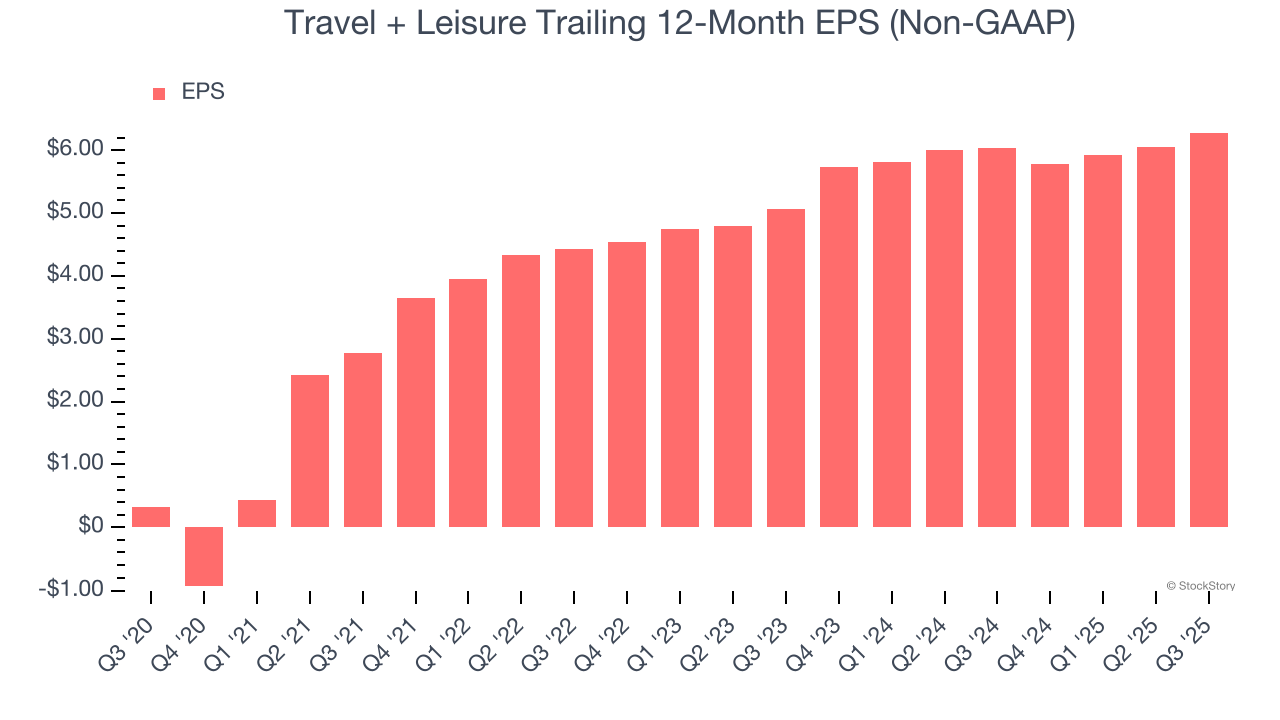
In Q3, Travel + Leisure reported adjusted EPS of $1.80, up from $1.57 in the same quarter last year. This print beat analysts’ estimates by 5.2%. Over the next 12 months, Wall Street expects Travel + Leisure’s full-year EPS of $6.28 to grow 13.9%.
Key Takeaways from Travel + Leisure’s Q3 Results
It was encouraging to see Travel + Leisure beat analysts’ EBITDA expectations this quarter. We were also glad its EPS outperformed Wall Street’s estimates. On the other hand, its . Overall, this print had some key positives. The stock traded up 3.8% to $63 immediately following the results.
Should you buy the stock or not? If you’re making that decision, you should consider the bigger picture of valuation, business qualities, as well as the latest earnings. We cover that in our actionable full research report which you can read here, it’s free for active Edge members.